December in Metro Vancouver brings the real estate year to a close under the familiar rhythms of winter. Shorter days, colder weather, and the holiday season naturally slow market activity, as many households pause to reflect and plan ahead. While the pace of transactions eases, the market continues to offer clarity for those assessing opportunities and positioning for the new year. Current market conditions are giving buyers and sellers space to pause, assess, and prepare as 2026 approaches.
Home sales registered on the Multiple Listing Service® (MLS®) throughout 2025 in Metro Vancouver* closed the year down 10 per cent, marking the lowest annual sales total in more than two decades. “This year was one for the history books. Although the sales total was the lowest in over two decades, Realtors were still busy listing properties. Sellers brought the highest total of listings to market on record since the mid-1990s, eclipsing the previous record high in 2008 by a little over 1,000 listings,” said Andrew Lis, Greater Vancouver REALTORS’ director of economics and data analytics.
Residential Sales
The Greater Vancouver REALTORS® (GVR) reports that residential sales in the region totalled 1,537 in December 2025, a 12.9 per cent decrease from the 1,765 sales recorded in December 2024. This was 20.7 per cent below the 10-year seasonal average (1,937).
Inventory + Home Price Data Analysis
There were 1,849 detached, attached and apartment properties newly listed for sale on the MLS® in Metro Vancouver in December 2025. This represents a 10.3 per cent increase compared to the 1,676 properties listed in December 2024. This was 10.3 per cent above the 10-year seasonal average (1,677).
Metro Vancouver Home Sales by Property Type
Across all detached, attached and apartment property types, the sales-to-active listings ratio for December 2025 is 12.7 per cent. By property type, the ratio is 9.3 per cent for detached homes, 14.6 per cent for attached, and 15.1 per cent for apartments.
Analysis of the historical data suggests downward pressure on home prices occurs when the ratio dips below 12 per cent for a sustained period, while home prices often experience upward pressure when it surpasses 20 per cent over several months.
Detached Homes
Sales of detached homes in December 2025 reached 431, a 12.8 per cent decrease from the 494 detached sales recorded in December 2024. The benchmark price for a detached home is $1,879,800. This represents a 5.3 per cent decrease from December 2024 and a 1.1 per cent decrease compared to November 2025.
Apartments
Sales of apartment homes reached 791 in December 2025, a 11.2 per cent decrease compared to the 891 sales in December 2024. The benchmark price of an apartment home is $710,000. This represents a 5.3 per cent decrease from December 2024 and a 0.6 per cent decrease compared to November 2025.
Attached Homes
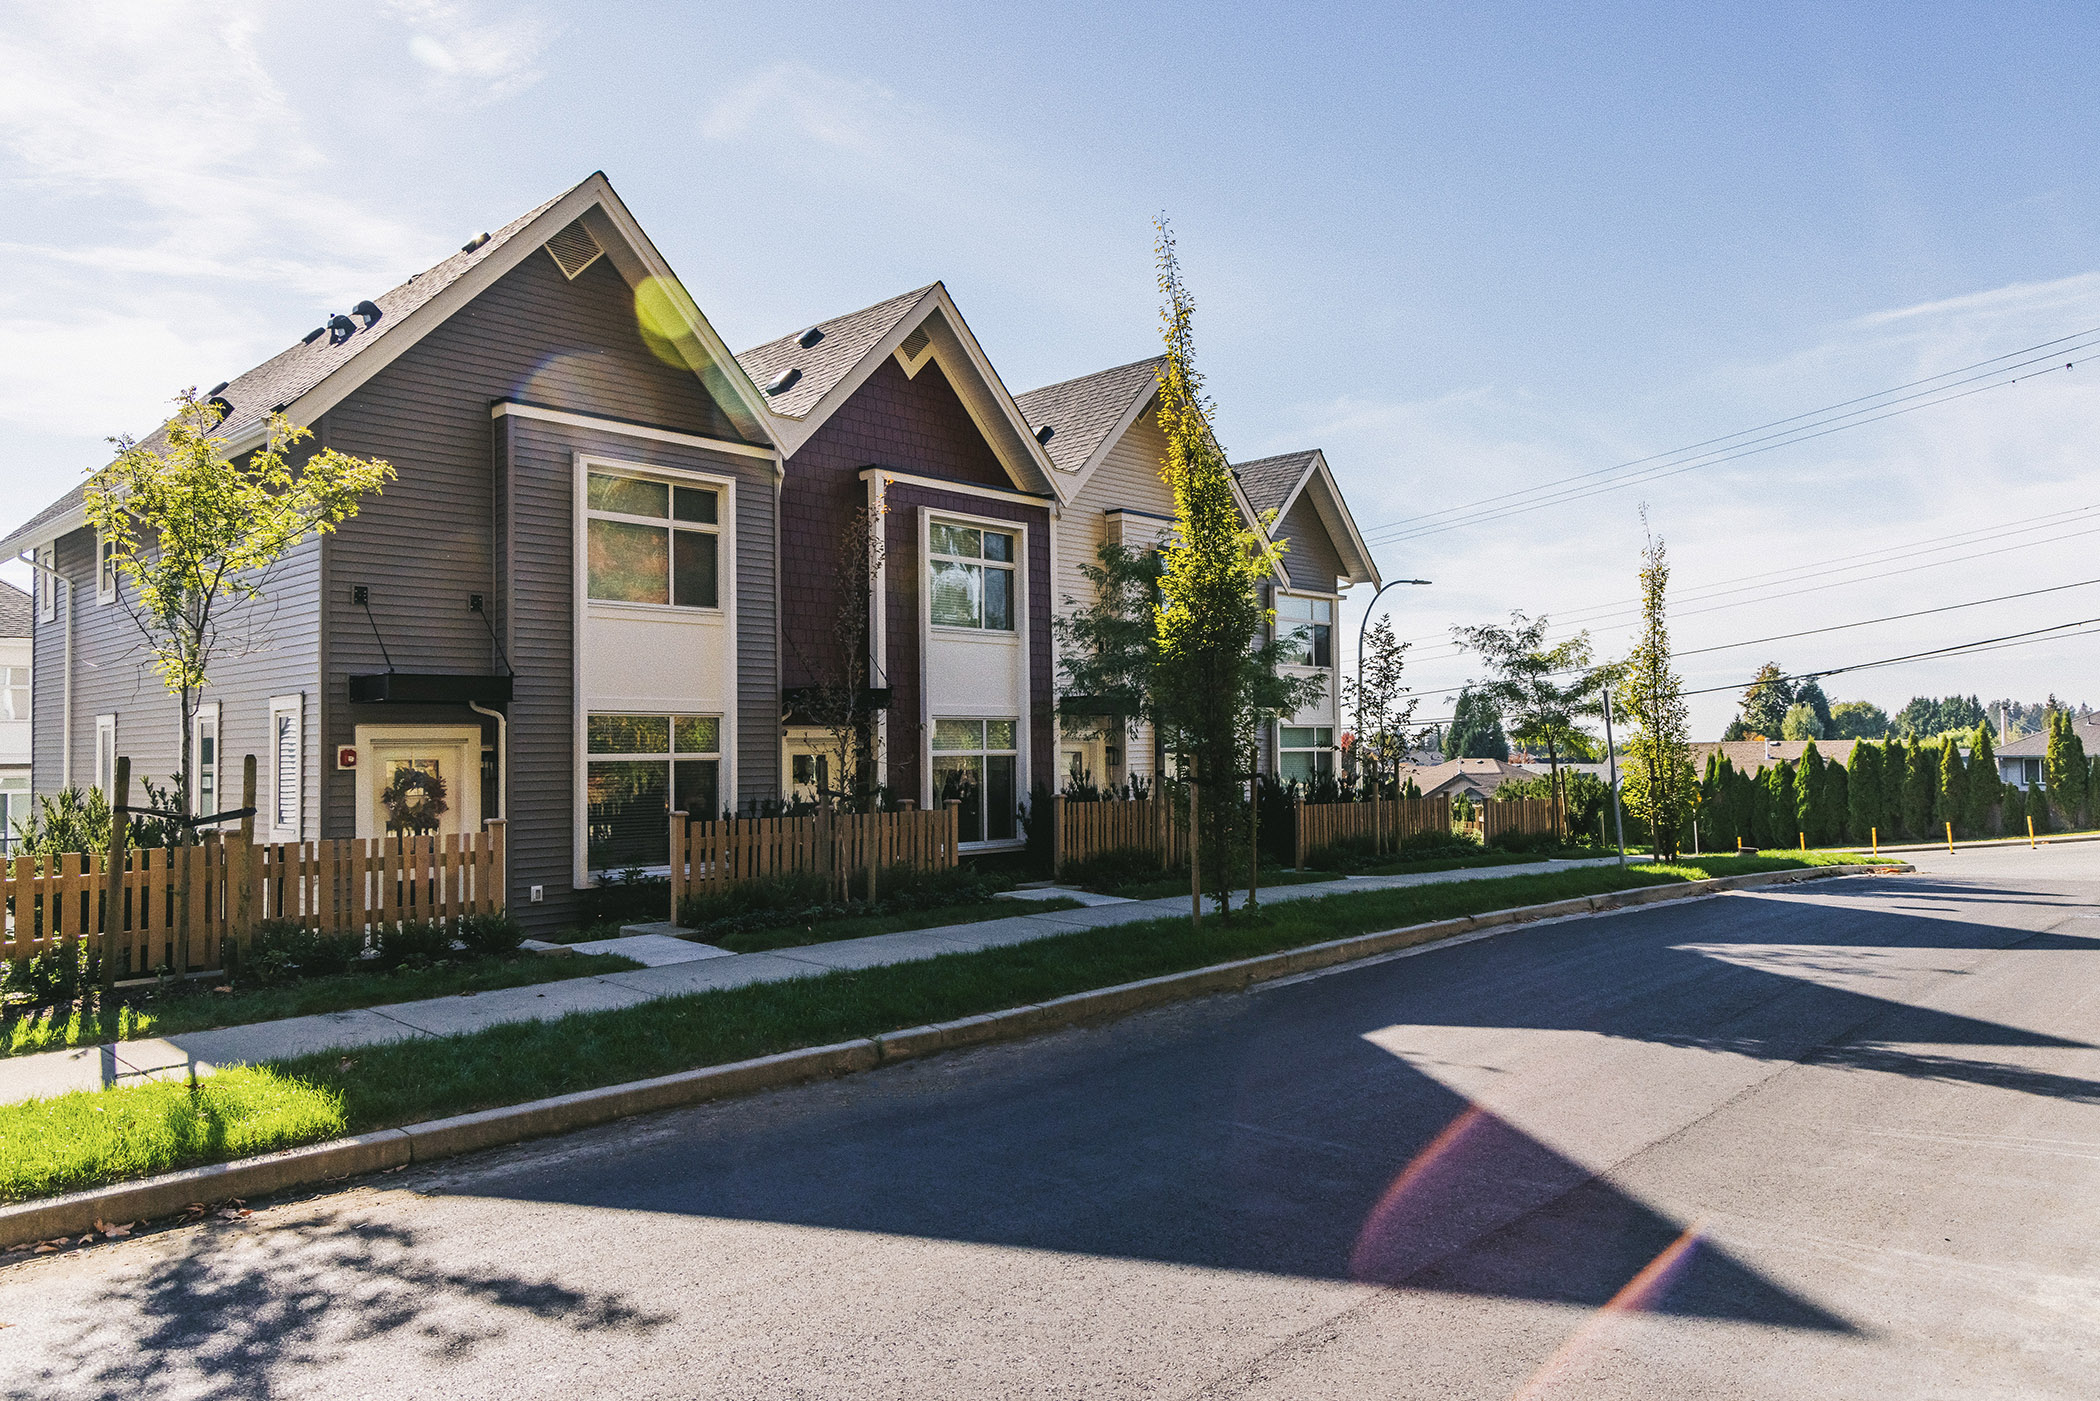
Attached home sales in December 2025 totalled 303, an 18.3 per cent decrease compared to the 371 sales in December 2024. The benchmark price of a townhouse is $1,056,600. This represents a five per cent decrease from December 2024 and a 0.8 per cent decrease compared to November 2025.


